Default message goes here.


Search
Federal Individual Income Tax Returns by State, County, and Zip Code
RAND State Statistics recently updated its Federal Individual Income Tax Returns database with detailed information on income tax returns filed in the United States from the year 2011 to the year 2018. Here are some highlights of the trends observed in the eight years.
A total of 146,455,970 U.S. returns were filed in the year 2011 (Table 1). This dropped in 2012 to 145,025,440, the lowest number of returns filed during the entire period of 2011 to 2018. This low point is probably related directly to the long-lasting impacts of the Financial Crisis.
The total number of returns filed in the U.S every year has continued to rise to 153,456,000 in 2018. In addition, the number of electronically-filed returns reached 89.6% of all returns in 2018. More than 14% of all returns reported taxable Social Security benefits in 2018, an increase from the 11.4% rate in 2011.
Table 1
Source: RAND State Statistics
Filings Vary Across States
The state with the highest filings through the years 2011-2018 was California, followed by Texas, Florida, New York and Pennsylvania. These states were the top 5 income tax return filing states in the United States. In 2011, California constituted almost 11.7% of the total filings and rose to 11.8% in the year 2018.
Texas on the other hand, constituted 7.8% of the total filings in 2011 and rose to 8.2% in 2018. Florida showed the highest growth among the top five states with 6.6% in 2011, rising to 8.2% in 2018. New York constituted 6.4% of the total filings in the United States in 2011 which decreased marginally to 6.4% in 2018. 4.2% of the total filings were made by Pennsylvania in the year 2011, decreasing to 4.07% in 2018.
Charitable Deductions Surges in 2018
The average charitable deduction between 2011 and 2018 increased nearly 200%, more than 16% per year on average (Figure 1). On closer inspection, this increase was driven by a surge of charitable deductions in 2018 at nearly $13,300.
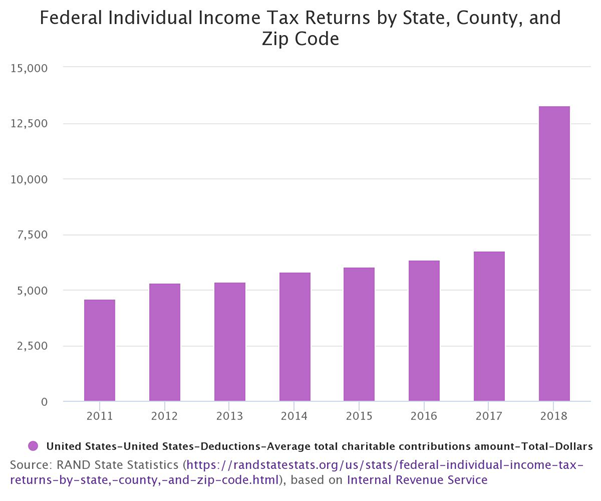
Figure 1
The total tax liability share of taxable income increased steadily over this time period, reaching a 21.0% share in 2015. This fell rather sharply in 2018 to 18.3% (Figure 2).

Figure 2
Average salaries and wages grew steadily from about $50,000 per year to $62,400 from 2011-2018 (Figure 3), an overall increase of 23.4% and an annual average of 3.0%. In contrast, average net capital gains experienced a bumpier ride. But average net capital gains more than doubled, from $16,600 in 2011 to $36,300 in 2018.

Figure 3
The number of farm returns for the United States fell at nearly 1.0% per year on average. The steepest declines occurred in five states (excluding the District of Columbia) (Table 1 and Figure 4).
Table 2
| State | Change in Farm Returns, 2011-2018 |
| Delaware | -14.0% |
| California | -13.3% |
| Kentucky | -12.8% |
| North Carolina | -12.4% |
| Washington | -11.9% |
Source: RAND State Statistics

Figure 4
Finally, the average state and local income tax deductions jumped sharply in 2018 to nearly $15,800, a doubling of the 2011 level and an increase of 45.8% over 2017 (Figure 5). This likely is a direct effect of the Tax Cuts and Jobs Act passed by Congress and signed by the President in late 2017.

Figure 5